
Written with JAscencio, who led half of the analysis in this post.
A strange concurrency problem
An InsForge customer is building a product-label printing system for retail. Dozens of store agents participate in the workflow:
- Store staff trigger a print from a handheld device or a fixed printing station
- The backend writes the print job into the InsForge database
- A local Windows agent in each store polls InsForge, claims the job through an RPC, and sends it to a Windows printer
- When idle, an agent issues a claim roughly every 1–2 seconds and a heartbeat every 30 seconds
Their stores print product labels. A single price change generates thousands of jobs at once: a normal business action, but one that naturally produces synchronized bursts. The claim endpoint handles about a million requests a day.
The customer sent us a fifteen-minute window from production:
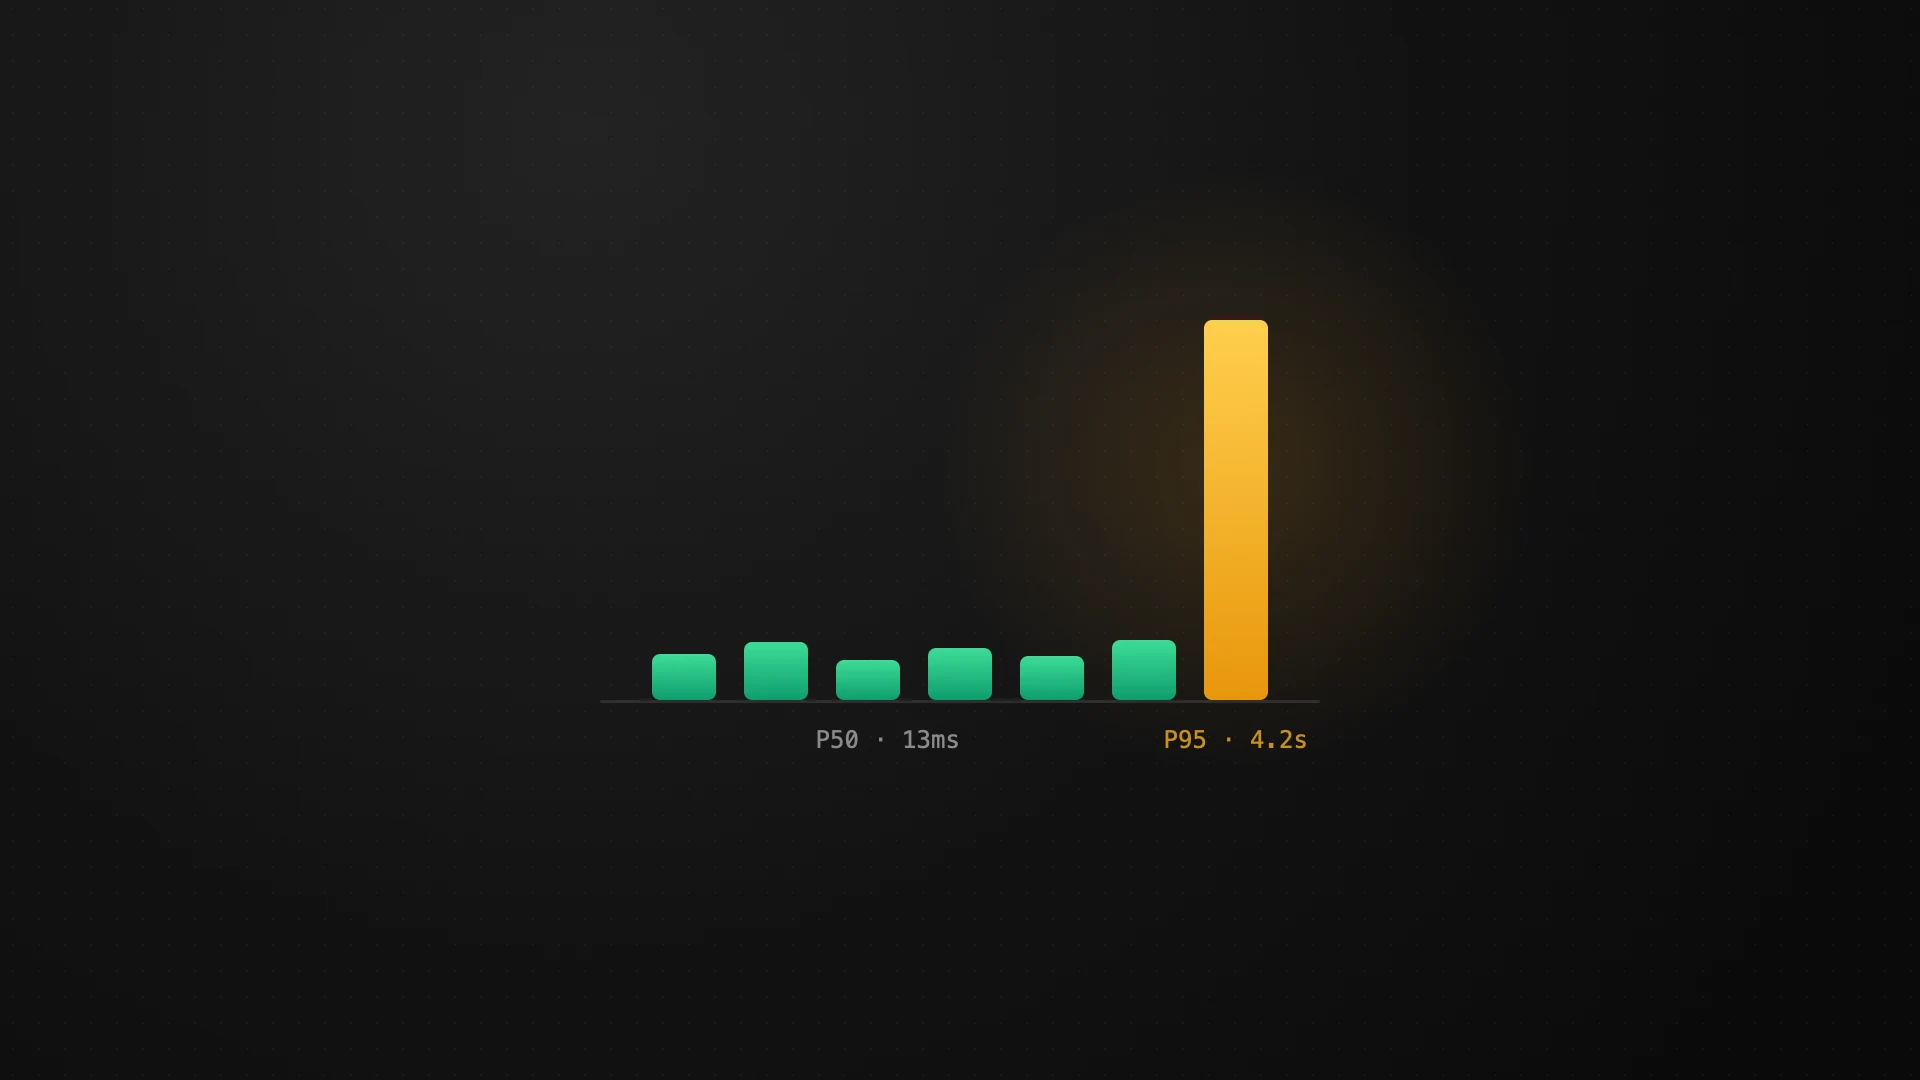
peak throughput   113 RPS   (theoretical ceiling ~400)
P50                13 ms
P95             4,168 ms
P99             6,857 ms
max            14,166 ms
P50 normal, P95 sharply degraded. This looked like a systemic problem. Our initial line of discussion was the retry logs on the InsForge side. From the platform's point of view, retrying automatically during a business peak is reasonable behavior, and the application layer can smooth things out with a queue. The customer rejected that suggestion immediately: printing a label on a store device is a highly latency-sensitive operation, and here the retry latency is the product experience.
So we started examining the platform architecture and configuration properly.
Publishing the layers
Nobody can discuss where the bottleneck is without seeing which layers the traffic passes through, so we published it (using the customer's existing EC2 micro instance as the example):
backend  →  PostgREST  →  PostgreSQL

PostgreSQL              max 60 connections
PostgREST → Postgres    pool of 50
backend → PostgREST     HTTP pool of 20 sockets   ← hardcoded
In the scenario we had in mind, 20 keep-alive sockets should carry roughly 400 RPS as long as calls are fast. And at the moment the customer reported an ECONNRESET, the instance was at about 23% CPU, with no restarts and no memory pressure. Not a machine problem.
Publishing those numbers is what made everything afterwards possible. The customer's very next message contained the turning point of the whole investigation: 113 RPS is far below the 400 ceiling and P50 is clean, so this is queueing or contention, not slow SQL.
Ruling things out one by one
Indexes. The customer ran a read-only audit of the claim path. Agent resolution uses a unique index; job selection uses a purpose-built partial index with over 40 million recorded scans. No sequential scans in any plan, only a few hundred live rows in the table, 99.3% cache hit ratio, zero lock waits.
Slow SQL. We enabled pg_stat_statements. There were genuinely two slow statements: an exact COUNT(*) over tens of thousands of catalog rows at ~627 ms, and a printer-profile lookup at ~500 ms against a table holding only 50 rows. Neither sits in the claim loop, and both are called rarely. The claim RPC itself averages 0.459 ms. They can hold a socket and amplify a burst, but they can't sustain pool saturation.
Database capacity. Every postflight check produced the same result: 4 of 60 connections active, zero lock waits, zero slow queries.
Concurrency. This hypothesis died on a single observation. In an idle test environment, one user opened a page. Neighboring endpoints returned normally in 7–24 ms, PostgreSQL logged nothing, and one of the requests received an ECONNRESET, then succeeded on retry.
No load, and a reset anyway. Capacity problems don't reproduce at a concurrency of one, so something else had to be in play. Specifically: could a socket PostgREST had already closed still be sitting in our HTTP agent pool, waiting to be handed out for reuse? We checked the connection pool configuration on both sides. It could.
That error message. Under load, the agents were surfacing a Spanish "printing service temporarily busy." We guessed it came from the customer's SQL function. They checked the live definition with pg_get_functiondef and showed the function raises exactly two messages, neither of them that one. It was their own agent's wrapper around an HTTP 503.
The way through was to get the raw response body. Our backend passes PostgREST errors through byte for byte, so we asked the customer to hit the RPC with concurrent curl, bypassing their own application layer:
60 concurrent × 5 waves = 300 calls
211 successful / 81 HTTP 500 / 8 transport errors

{"error":"INTERNAL_ERROR","message":"socket hang up","statusCode":500}
No P0001, no SQL exception envelope. A transport-layer failure. Database connections during that window: 4 of 60. The failing requests never reached the database at all.
Two root causes
A stale keep-alive race. Sockets PostgREST had already closed remained in our agent pool and were handed out to new requests. This is the one that reproduced at a concurrency of one.
The query service's resource ceiling. On the customer's micro EC2 instance, we start three services together through docker-compose: Postgres, PostgREST, and InsForge. The PostgREST container is allocated 127 MB of memory and 0.3 vCPU. When 60–80 synchronized claims arrive at once, it can't drain inbound connections fast enough, and the kernel force-closes a batch of in-flight connections on hitting the container's memory limit. Hence the socket hang up errors.
The second cause explains the load-test ladder precisely: 30 agents completely clean, 40 → 2 errors, 60 → 25, 80 → 36. It also explains why the customer's normal traffic had a 0% error rate. Sustained polling is fine; failures occur only at the leading edge of a synchronized wave.
The fixes
To fix the misalignment between the connection pools across the three service layers, we shipped two bugfix releases and tested them jointly with the customer.
v2.2.8 made the http-agent socket pool scale dynamically with the EC2 instance size. Once it was raised to 50, the original reset-and-retry pattern disappeared entirely: zero retry warnings, zero transport errors. That is also exactly why the load-test ladder above became visible. With the narrow pool sitting in front, the next bottleneck can't be seen.
v2.2.9 performs an immediate replay for failures that can be attributed to a stale socket. Same test: 80 agents, 3 bursts, 240 jobs.
| v2.2.8 | v2.2.9 | |
|---|---|---|
| agent-visible claim errors | 145 | 12 |
| backend non-2xx | 147 | 11 |
| claim P99 | 5.751 s | 3.880 s |
| end-to-end P99 | 6.162 s | 4.298 s |
| jobs spooled | 240/240 | 240/240 |
| lost / duplicate | 0 / 0 | 0 / 0 |
That run triggered 182 replays, rescuing about 93% of transport resets.
This fix is deliberately limited. The claim RPC is a POST and isn't idempotent. Replay it in the wrong situation and you claim the same job twice, putting a duplicate price label on a shelf. So we replay only the failures attributable to a stale socket. Resets on freshly opened connections at the start of a burst (the signature of the capacity problem) are not replayed. The residual errors on the smaller tier are a choice, not an oversight. Better to return an error the agent can safely retry than to add a second, wrong price label to a shelf.
Separately, the memory and CPU limits for the query service now scale dynamically with instance tier, which is the mechanism that makes "move up a tier" actually resolve the second root cause.
Throughout all of this, at every concurrency level and in every failing test: 240 of 240 jobs spooled, zero lost, zero duplicated, zero stuck. For this workload, that matters more than the latency numbers.
Still open
The small tier isn't certified for synchronized 60–80 client bursts. Residual socket hang up is still reproducible there. Same battery on a larger tier next.
Takeaways
This went back and forth many times, and two things generalize for us. Publish your internal limits: the customer's decisive judgment was only possible once they could see all three pools. And before you accept a capacity hypothesis, try to reproduce at a concurrency of one; a single reproduction on an idle environment was worth more than every load test we ran combined.
About half the analysis here came from the customer. They audited production read-only, used real windows rather than synthetic traffic, verified our claims with pg_get_functiondef, declined to credit their own cleanup for an improvement without hourly evidence, and required written approval for every production change. It's a privilege for InsForge to support a customer this rigorous in building a product this serious.